This post was originally published on this site
In part one of this article, Alex Moss from the John Lewis Partnership covered the metrics that they use to measure the value of their developer platform. Now, let’s talk about a crucial aspect of any measurement strategy: choosing the right things to measure. It’s easy to get lost in a sea of data or to focus on metrics that look impressive, but don’t actually reflect the health of your platform or the experience of your developers. Here, Alex shares the John Lewis philosophy on how to choose meaningful metrics and present them in a way that drives the right conversations and actions, ensuring that the data is always presented with as much context as possible. – Darren Evans
While the solution we detailed in the first half of this article worked very well, relying solely on objective measures comes with a number of traps. They are very easy to misinterpret: either wasting time (“the team is working on another product at the moment”) or not telling the right story (“the incident wasn’t closed properly”). This leads to a scaling challenge: Chatting with a small number of teams to understand a situation is one thing. But when you are only one small team trying to build a product, and you need to talk across several dozen teams, it’s not so easy.
Collecting engineers’ subjective feedback
We needed a way to collate more subjective feedback, ideally in a form that we could visualize and contrast to the objective DORA and other service metrics we held.
Our initial attempt at this involved creating Service Operability Assessments — questionnaires that tenants fill in every quarter. Service Operability Assessments are intended to hold a series of thought-provoking questions aimed at whether the team is following good practices for running their service. This worked well with an experienced facilitator (usually a senior platform engineer) who could ask further probing questions and pull out the key feedback and actions. But as you might imagine, this suffered from scaling challenges. We eventually let this be handled entirely self-service — an imperfect system, since many teams are quite happy to just copy/paste their answers from the previous quarter, which may or may not reflect reality!
We then learned about a tool called the DX platform, which significantly changed how we approached this, and which is now used across our entire Engineering community. It works by surveying individual engineers (rather than teams) for a few minutes every three months. The questions are curated based on DX’s research, backed by the founders of DORA and other similar frameworks. We’ve found it very helpful to be able to slice the results in different ways, including looking at areas across whole platforms or deep-diving on particular teams. The latter, in combination with our DORA data, makes for rich conversations. For example, in the DX tool, a team which recently suffered through some highly impactful incidents might also have registered concerns on “Production Debugging,” while another team that saw a marked drop in release frequency flagged worries around “Change Confidence” or “Ease of Release.” The platforms team can at this point step in to offer advice or potentially implement new features to help with the issues the teams are seeing.

The pre-built drivers and reports in DX are tremendously useful, but we also augment it with our own custom queries to help us understand areas of current focus. For example, we measure Customer Satisfaction (CSAT) for the platform and its portal (Backstage), and collect data on how long it takes for a newcomer to begin submitting pull requests and ask them about how they found the onboarding process. We also recently started assessing engineers’ opinions on the effectiveness of AI coding assistants to help justify further investment in them (instead of just relying on market insight).
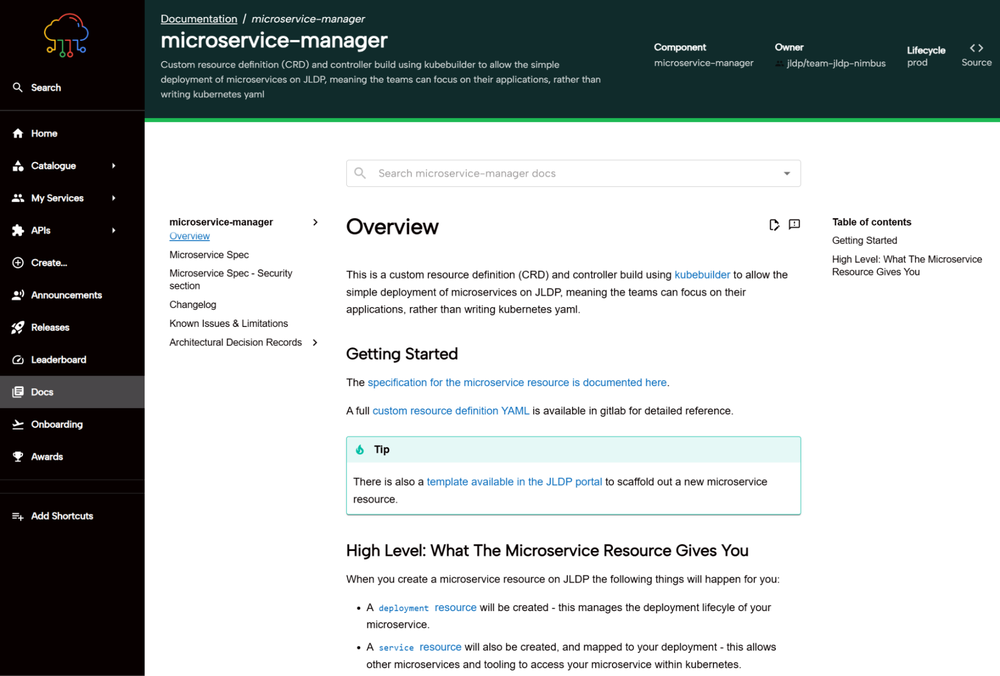
An example of where this helped focus our efforts was with documentation, namely, building capabilities into our Backstage developer portal to make it easier for teams to view each others’ docs through pipelines that automatically publish content and make it discoverable.
Service health – Feature adoption & beyond
Outside of the insights we generate from the likes of DORA and DX, we’ve recently begun questioning not only whether the platform itself is valuable, but whether tenants are getting the value they should from it. In other words, we’ve effectively started to measure platform feature adoption.
To do this, we built out what we refer to internally as our Technical Health feature. It takes the form of a custom plugin that integrates with our Backstage Developer Portal, which then queries an in-house API that surfaces data fed from a large number of small jobs that collect information on the things we want to measure. These jobs are independently releasable themselves, which allowed us to scale this up pretty quickly.
We currently capture four categories of health measures:
-
Technical health: We currently have 17 “technical” measures. Examples here include measuring whether teams are using our paved road pipeline and custom Microservice CRD (see previous articles 1 and 2) rather than “terraforming” their own resources, following our recommended Kubernetes practices (such as resource sizing, disruption budgets and lifecycle probes), keeping base images up to date, and the like. We also include some “softer” technical measures such as whether they are running pipelines frequently enough to pick up changes (we don’t run this for teams), reviewing their operability assessments, staying on top of git branches, and so on.
-
Operational readiness: Then, there are 18 measures relating to operational health — things like whether a pre-flight configuration is in place, whether runbooks are written, docs have been published, and so on. This is an evolution of an Operational Readiness checklist from several years ago (back when we used to have separate Delivery and Operations teams, and therefore these sorts of checks were mandatory for “handover”). We tailored this checklist to the specific features of the platform that help teams achieve good operability, rather than being a generic list. This also serves to help our Service Management team feel confident that the right practices are being followed, thereby eliminating a point of friction when carrying out manual reviews.
-
Migrations: From time to time, the Platform requires tenants to carry out work to keep up with changes to the platform itself. A classic example of this is getting teams to deal with deprecated Kubernetes API versions. This also includes adoption of different features that we want to drive more forcefully in order to remove the older way of doing things (say for example, in favour of something more secure). We found that as the Platform grew, we had a long tail of migration work that we needed teams to perform, providing an easy way for Product Managers and Delivery Leads to prioritize their teams’ workloads.
-
Broader engineering practices: We recently opened up the feature to allow other teams to contribute — in this case, our Engineering leadership — to build in their own measures, such as whether teams are keeping up to date with versions of our design system or whether they’re following broader engineering practices that extend beyond just the JL Digital Platform.
We present this data through aggregated views (like the example shown below), as well as individual tasks and broader leaderboards — all designed to catch the eye of those with influence over a team’s priorities. We’ve found that the desire for an engineer to turn a traffic-light green can be a powerful motivator — far more effective than relying on documentation or announcements.

This technology works through custom plugins that we’ve built for the Backstage Portal. Each “health check” is itself its own microservice (often running as a job) which interrogates the appropriate system to determine whether the measure is met. For example, one microservice checks that a PodDisruptionBudget has been created by querying Kubernetes directly, while another that looks at whether distroless base images are in use, does so by inspecting container image layers. There’s a template for creating new metrics, which makes it easy for engineers to create new ones — including those outside the platform team themselves. The results are stored in BigQuery, with an API to make Backstage plugin development simpler.
A reality of introducing measures like this is that it drives more work into the product teams. It is important that your culture be ready for this. If we had implemented these measures very early in the platform’s life, this would likely have affected how the product was perceived — perhaps as very strict or inhibiting the pace of change with guardrails. This can negatively impact overall adoption. By introducing these later on, we benefited from many tenants who already saw the platform as very valuable, as well as the confidence that we had selected the right measures and could apply them consistently. That said, we did still see a small drop in CSAT for the platform after we started doing this. We try to be considerate about the pace that we launch each measure to give product teams the time to absorb the work, as well as provide a means for teams to suppress the indicators that aren’t relevant to them. For example, a tenant might deliberately choose not to use pod autoscaling for performance reasons, or have a functional reason why they can’t use our Microservice CRD.
The introduction of these sorts of assurance measures on tenant behaviour is a reflection of the maturity of the platform. In the early days, we relied on highly skilled teams to do the right thing whilst going fast. But as time has passed, we’ve witnessed a variety of skills and capabilities, combined with shifts in ownership of services, that pushed us to introduce techniques to drive the right outcomes. This is also due to the platform itself becoming complex — the cognitive load for a new team is much higher than it was, due to all its new features. We needed to put some lights along the edges of our paved road to help teams stay on it!
Throughout this evolution, we’ve continued to report on our key results for the business themselves: Are we still doing what they want of us? This has naturally shifted from “go fast, enable teams” (which we largely see as a solved problem, to be honest) towards “do it safely, and manage your technical debt.”
Are you being served? Key takeaways
Long story short, the question of whether a developer platform has value is complex, and can be answered in many ways. As you embark on building out — and quantifying — your own developer platform, here are a few concluding thoughts to keep in mind:
-
Measurement is a journey, not a destination: Start by measuring something meaningful to your stakeholders, but be prepared to adapt as your platform evolves. In the beginning, it’s okay to prioritize further investment in your product, but it’s better to actually measure how the platform is enabling your teams. The things that mattered when you were initially proving out the platform’s viability are unlikely to be what are important several years later when your features are more mature and your priorities have shifted.
-
Listen to the humans: Don’t assume that just because your platform is being used, that it is providing value. The most powerful metrics are often qualitative; engineers wanting to use your tool and CSAT are strong signals, but asking them questions about how they are using it is a better way to gain insight into how you can improve it. It is hard to figure out what’s working (and what isn’t) through measurement alone.
-
Data is for enabling, not just reporting: Use your insights to help teams improve, not just to show graphs to leadership. Further, be transparent about what specific data led you to act. For example, when you see a dip in release frequency for a specific team, use that data to start a conversation about potential roadblocks rather than simply flagging it as a problem. By doing this, you build the trust and goodwill with both leadership and your tenants to keep moving the platform forward.
The evolution of the John Lewis Partnership’s measurement strategy serves as a compelling case study. By transitioning from basic lead-time tracking to a holistic model — blending DORA metrics with qualitative developer feedback — they demonstrated that true platform success is defined by the genuine value it delivers, not merely by adoption rates.
To learn more about platform engineering on Google Cloud, check out some of our other articles: Using Platform Engineering to simplify the developer experience – part one, part two, 5 myths about platform engineering: what it is and what it isn’t and Another five myths about platform engineering. We also recommend reading about App Hub, our foundational tool for managing application-centric governance across your organization.