
To make informed decisions, businesses often need to connect their internal data with public reference data, to create a knowledge graph that connects real-world things and their relationships. However, bridging data from public and private worlds has traditionally been complex. Today, we are streamlining these connections with the general availability of Data Commons on Spanner Graph and the preview of the new Data Commons Platform to unify your private knowledge with knowledge graphs from public datasets.
The overarching Data Commons project supports Google’s mission to organize the world’s information and make it universally accessible and useful. Data Commons unifies fragmented public datasets from over 100 authoritative providers, including the United Nations, World Bank, US Census Bureau, Eurostat, WHO, and NOAA, with over 400 billion data points structured using standardized Schema.org definitions. Data Commons provides data exploration tools, MCP tools, and cloud-based APIs to access and integrate the clean datasets.
Data Commons integrates public information across multiple domains, including agriculture, demographics, economy, environment, and health. This standardized approach unlocks powerful use cases, for instance, letting you analyze national GDP trends, map regional smoke pollution levels, track local health equity, or demographic distributions over time, all using data that has already been preprocessed and normalized for you.
Data Commons knowledge graph dimensions
|
Dimension |
Size |
Technical description |
|
Statistical observations |
400+ billion |
Individual metric data points |
|
Graph edges |
2.6+ billion |
Relationships |
|
Knowledge graph nodes |
1.7+ billion |
Standardized entities |
|
Data sources |
100+ providers |
Authoritative institutions |
Data Commons makes meaningful quantities of public administrative data available to users on readily consumable cloud-based infrastructure.
A modern infrastructure powered by Spanner Graph
When we first built Data Commons, our goal was to aggregate massive, disparate public datasets using the tools available at the time. The platform relied on Bigtable as a caching layer, which was an effective strategy for handling large-scale lookups in the absence of native graph database technology.
Today, we have transitioned our architecture to a native graph model with Spanner Graph, which brings the convenience of a SQL-like interface and graph expressiveness to Spanner, with its high availability, horizontal scale-out, multi-region transactional consistency, and native ISO/IEC 39075 Graph Query Language (GQL) support.
By adopting a multi-entity Spanner Graph schema, we represent entities as nodes and their domain links as dynamic graph edges, allowing us to move away from pre-computed cache structures and perform complex relationship queries directly within the database using GQL.
This architecture also simplifies our pipelines by removing the need for complex, pre-computed indices that require costly in-memory rebuilds and multiple snapshots. Spanner Graph enables incremental updates to specific datasets without refreshing the entire database, while stale reads maintain consistent data snapshots during ingestion.
Key benefits by moving to Spanner Graph
-
Unified storage and incremental updates: By utilizing Spanner Graph’s multi-entity schema, the platform replaces complex caches with a model that supports incremental data imports, allowing for targeted updates to specific datasets.
-
Dynamic graph traversals via GraphRAG: The system executes multi-hop queries such as navigating hierarchies like continent → country → state → county → city on the fly. This removes reliance on static caches and enables GraphRAG workflows, where the database maps natural language queries directly to structured path-matching traversals.
-
Consistent data snapshots: Leveraging Spanner TrueTime and stale reads, the platform provides you with a version-consistent snapshot of data, maintaining integrity across distributed nodes following batch ingestion cycles.
-
Operational analytics at scale: Spanner’s columnar engine efficiently scans massive time-series datasets by reading only the necessary fields, while BigQuery federation that leverages Spanner’s Data Boost technology performs complex aggregations via EXTERNAL_QUERY in an isolated environment, helping isolate production traffic.
Bridging systems with SDMX 3.0 interoperability
To facilitate the use of complex statistical data, Data Commons adopts a lean implementation of Statistical Data and Metadata eXchange (SDMX) technical standard. As an ISO specification, SDMX provides a consistent approach for describing and exchanging statistical data along with descriptive statistical meta-information.
In this Data Commons Platform update we added support for the SDMX technical standard version 3.0, providing out-of-the-box integration with third-party tools like Tableau, Flourish, and Observable for multi-dimensional datasets. This is made possible using the API standard SDMX-JSON and SDMX-CSV 2.0 formats across two high-value endpoints:
-
The availability API: A programmatic discovery mechanism to identify existing dimensions, variables, and date ranges without reading raw values.
-
The data API: Retrieves actual observations and metadata, using named parameters to help prevent code from breaking when dimensions are added.
Transforming private instances of Data Commons Platform
For organizations that want to build private instances of the Data Commons Platform, this new modern architecture resolves legacy scaling limits and simplifies data schematization. Developers can instantiate a private instance of the Data Commons Platform leveraging the same scalable technology that powers Google’s Data Commons instance. As a private instance, users retain full control of their own data and have the ability to limit access, while enabling natural language queries to blend results from their private data with Google’s public data that is hosted on the Google Data Commons instance. By federating across our public knowledge graph and a private knowledge graph containing your own data, you can light up exciting new use cases, while maintaining data isolation and ensuring no data duplication.
For instance, a retail enterprise can combine public data such as national GDP trends, regional demographic breakdowns, and employment statistics, with their own enterprise data, including sales histories, store performance metrics, and supply chain logistics. This allows analysts to contrast public macroeconomic indicators against their own company transactions to optimize merchandise distribution and identify untapped markets.

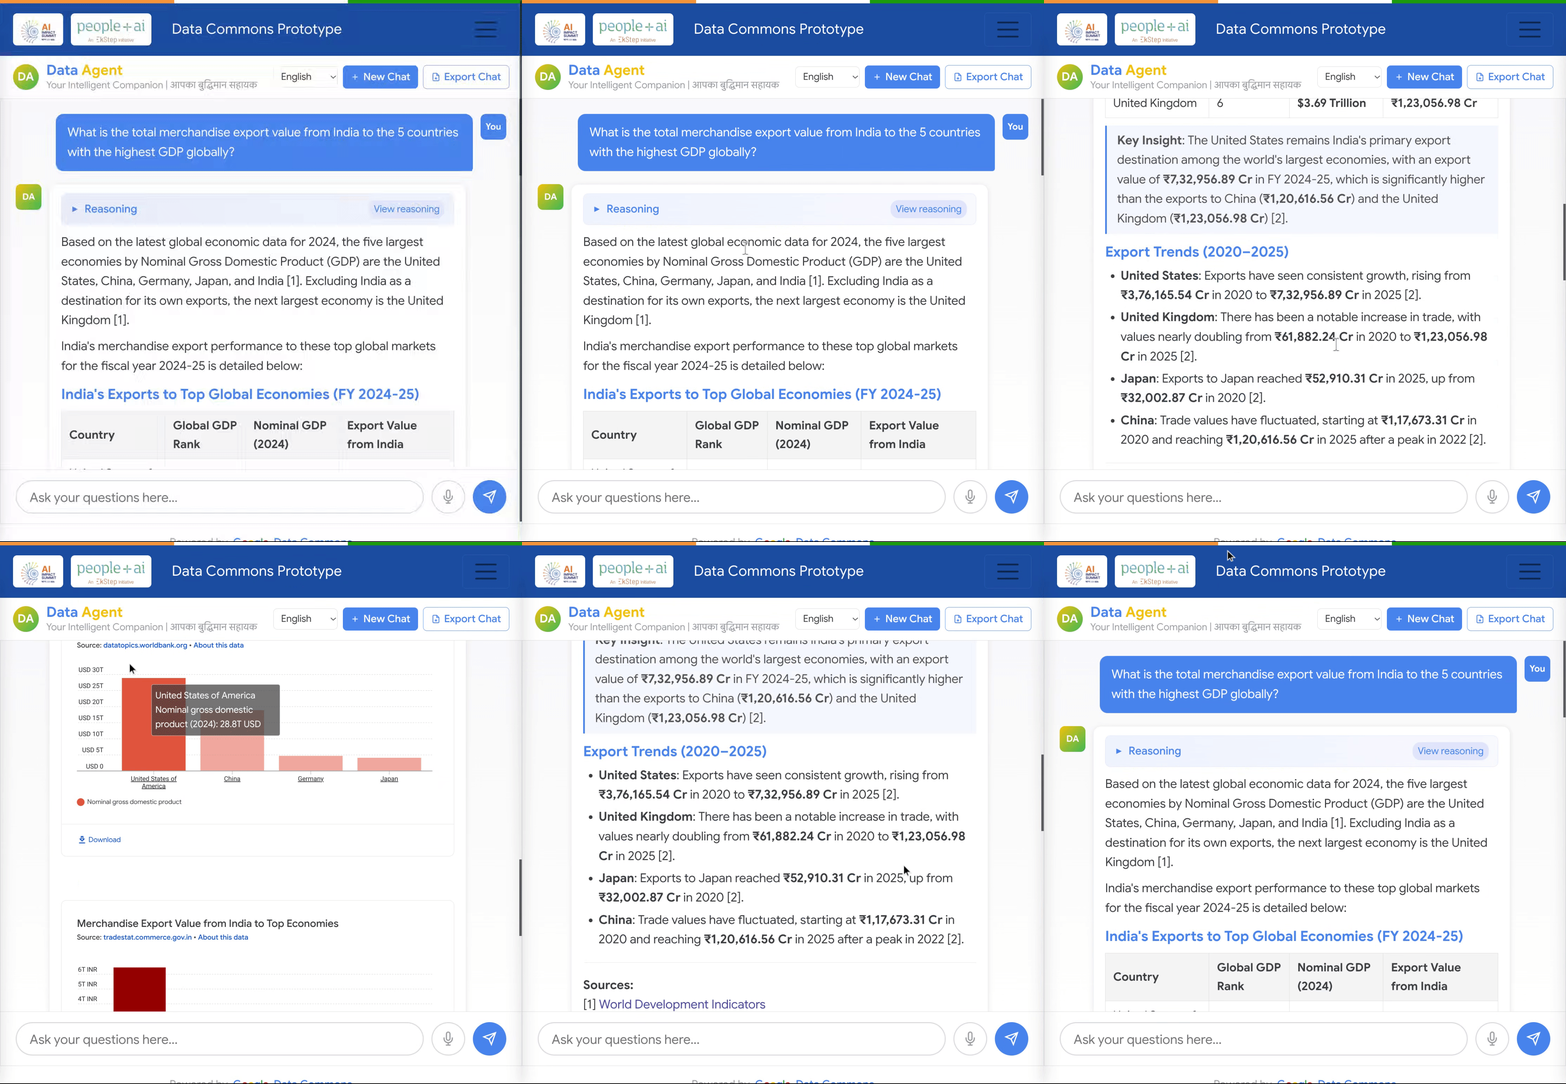
Example of a natural language query combining statistical data from the Directorate General of Commercial Intelligence and Statistics (DGCIS) stored in a Data Commons Platform private instance with World Development Indicators from the World Bank stored in the Google Data Commons public instance.
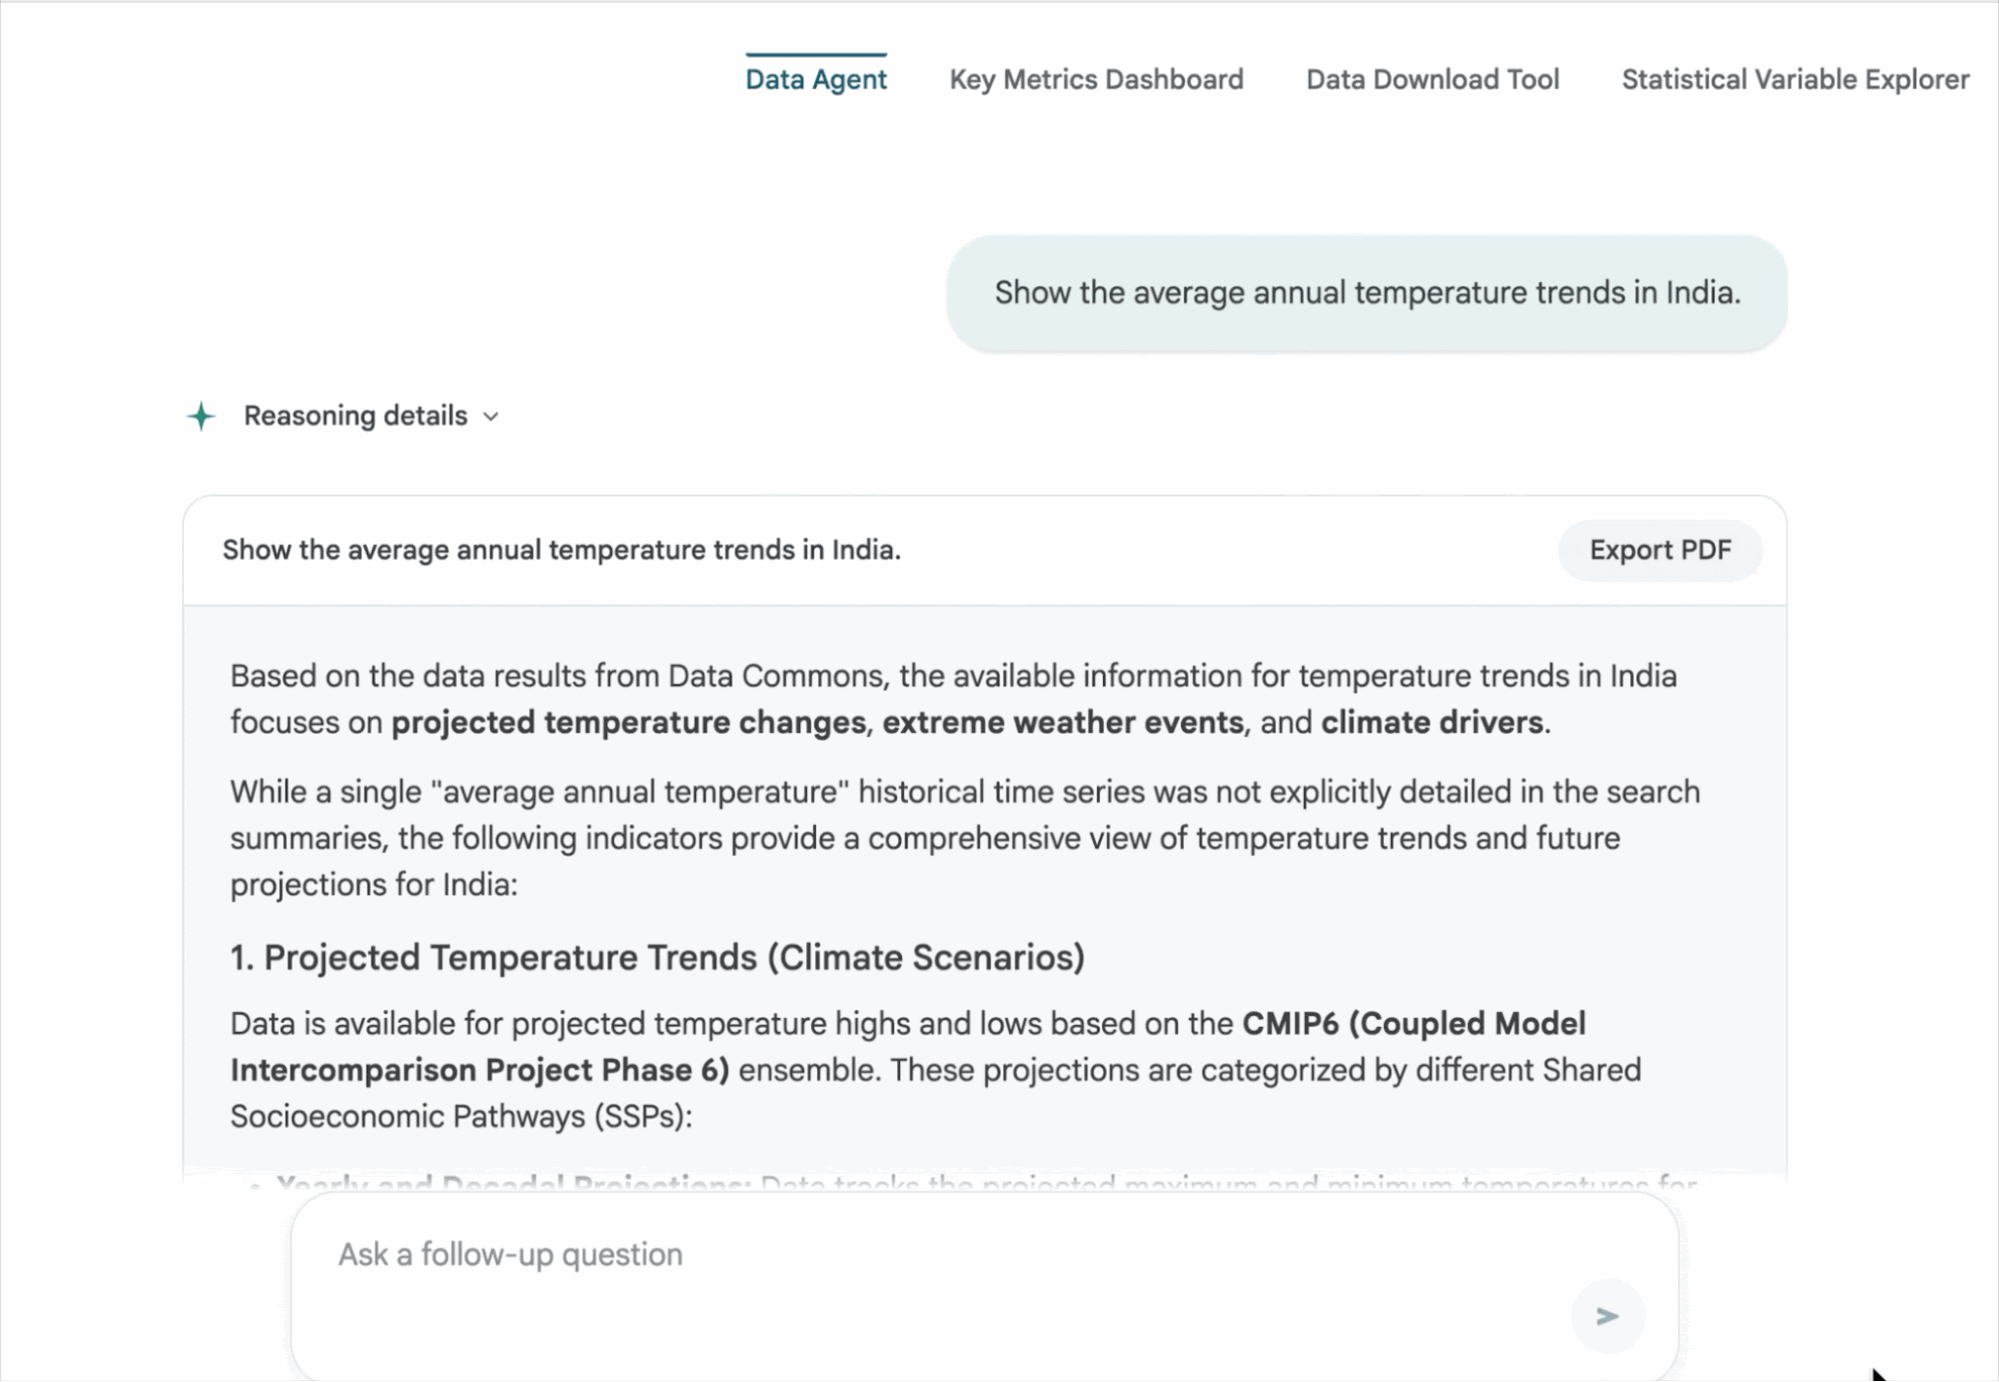
A user is querying a Data Agent for average annual temperature trends in the country. The agent retrieves information from Data Commons, explaining that while historical data is available, it provides projected temperature changes, climate drivers, and CMIP6 climate model scenarios (SSPs), with options to export the generated report.
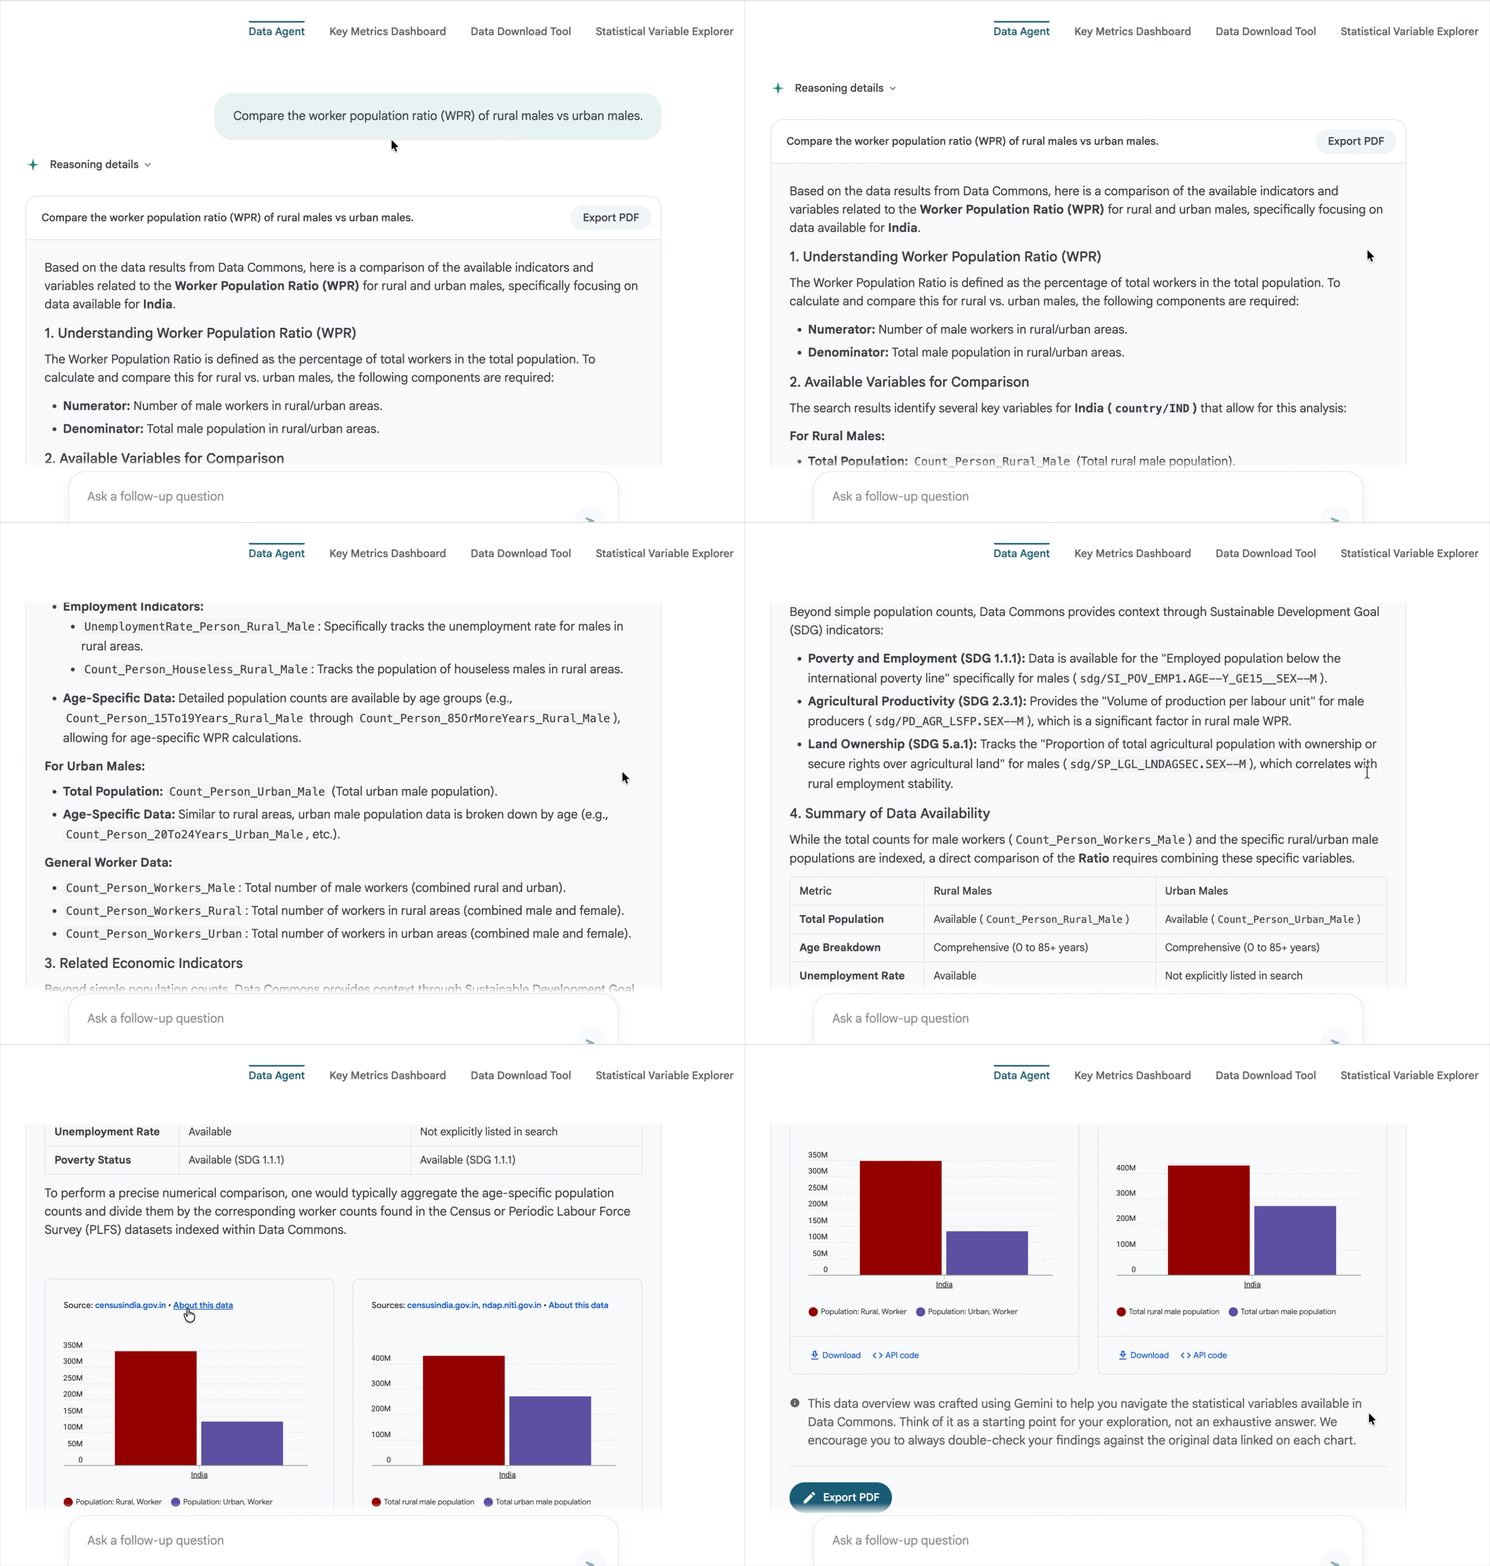
A user asks the Data Agent to compare the Worker Population Ratio (WPR) of rural versus urban males in a country. Fetching data from Data Commons, the agent defines WPR—the percentage of workers relative to the total population—and outlines the available demographic variables to analyze and compare both groups.
Get started today
-
Explore Data Commons: Visit datacommons.org to query global statistical knowledge.
-
Explore Spanner Graph’s use cases and setup guide for your knowledge graphs.
-
Deploy Data Commons Platform: contact support@datacommons.org to request preview access and to review the developer tools.