
Over the past year, we’ve focused on making Looker easier to use for every business user. We started by redesigning the exploration experience with drag-and-drop workspaces, streamlined field pickers, and conversational analytics to make it easier to start from a blank canvas.
The next step is elevating how your data is seen and interpreted.
This November, we are rolling out a major update for Looker’s visual language that brings new native chart types and dashboard controls to your dashboards, Explores, and feeds into your generative Data Apps. Everything runs on Looker’s governed semantic foundation and context from Knowledge Catalog. Here’s what’s new:
See the state of the business at a glance
-
KPI visualizations: Display core metrics with explicit period-over-period delta indicators, percentage trends, and directional status at a glance.
Displaying core business metrics and period-over-period trends with a KPI visualization.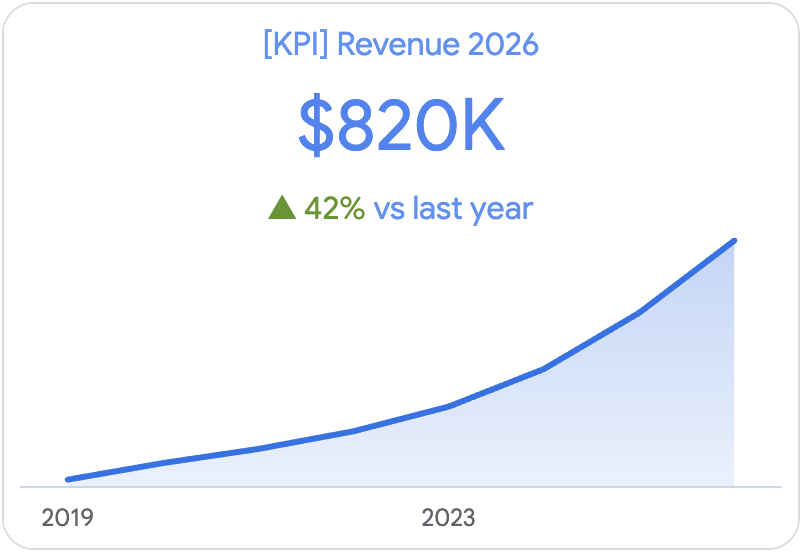
- Bullet charts and gauges: Stack actual performance against targets, quotas, and qualitative threshold bands in space-efficient layouts.
Tracking actual performance against targets with a Radial gauge chart.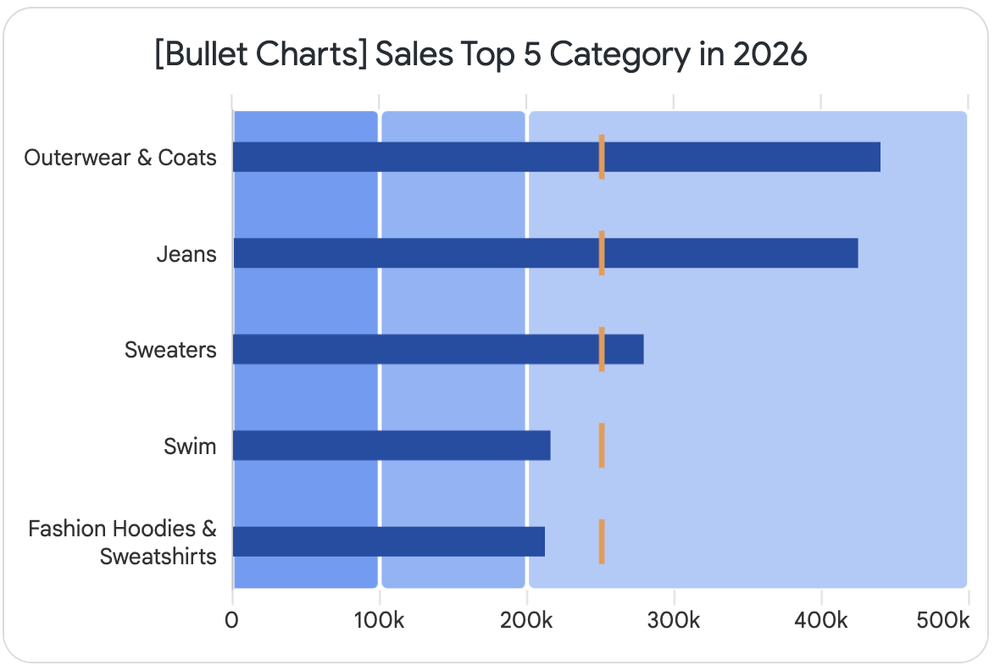
-
Compact numbers: Automatically render high-volume numbers into clean, human-readable formats ($2.4M instead of $2,400,000) that stay readable across any screen size.
Showcase the data behind the numbers
-
Sankey diagrams: Map multi-stage conversion funnels, user drop-offs, budget allocations, and material flows with native Sankey diagrams.
Mapping multi-stage conversion flows with a native Sankey diagram.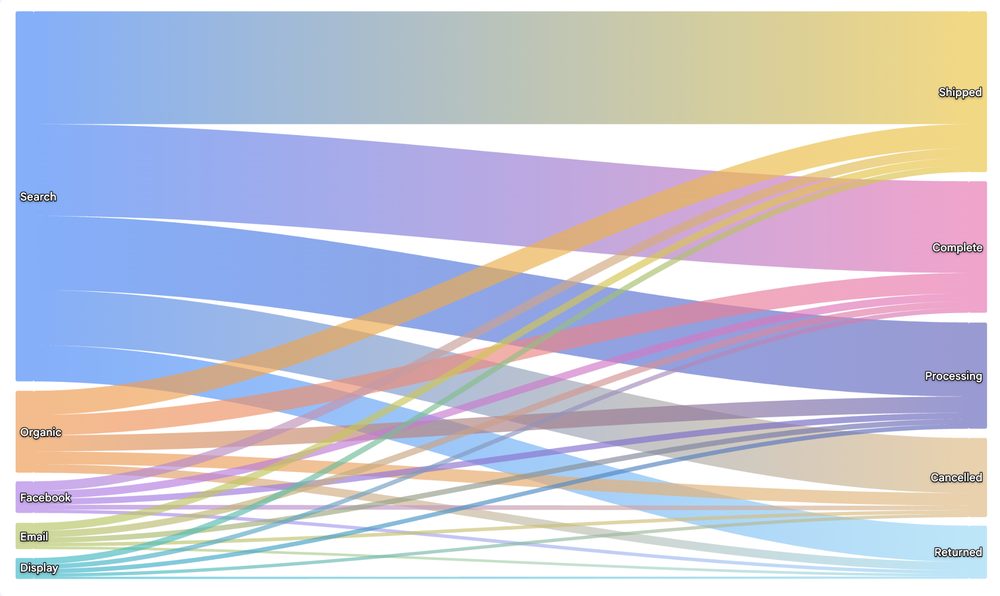
- Hierarchical tables: Drill into multi-level, nested data trees (such as category rollups or departmental cost centers) within a single structured tabular view.
Drilling into multi-level nested data within a Hierarchical table.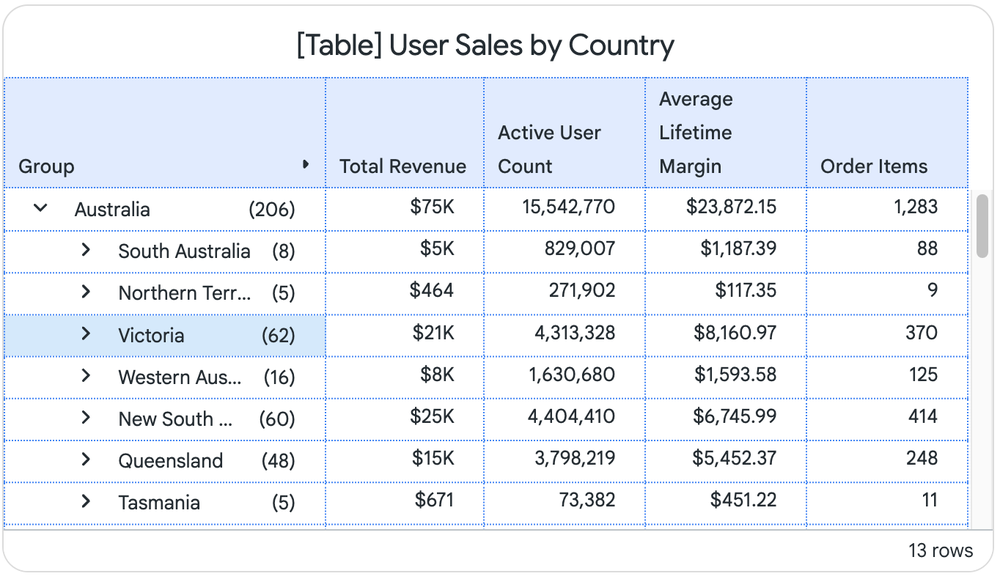
- Histograms: Plot frequency distributions and spot data skew and outliers across numeric variables without writing table calculations.
Plotting frequency distributions and outliers across numeric variables with a Histogram.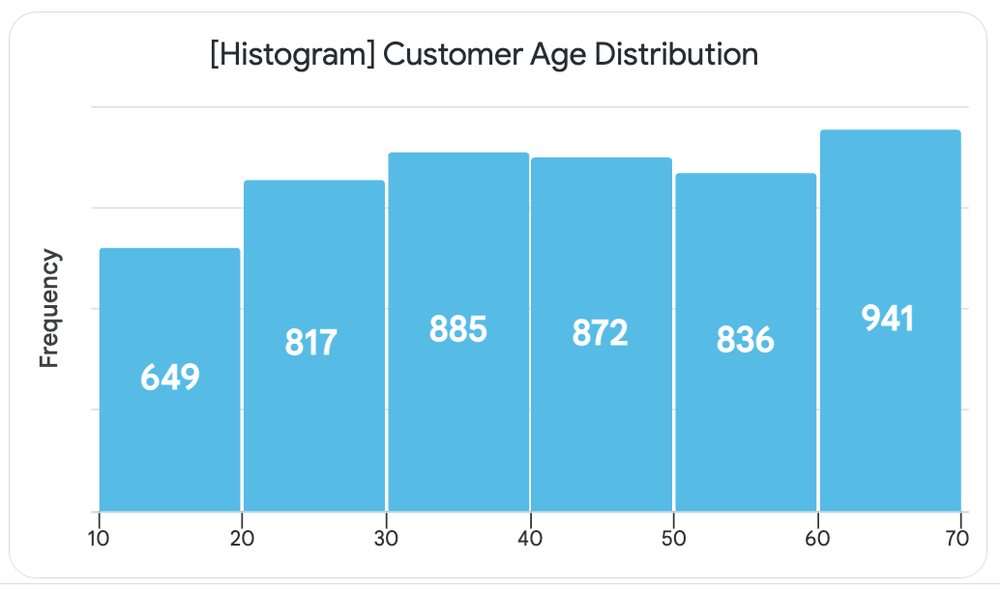
- Network charts: Visualize interdependencies, entity relationships, and interconnected graph nodes to uncover clusters and bottlenecks.
Visualizing entity relationships, clusters, and bottlenecks with a Network chart.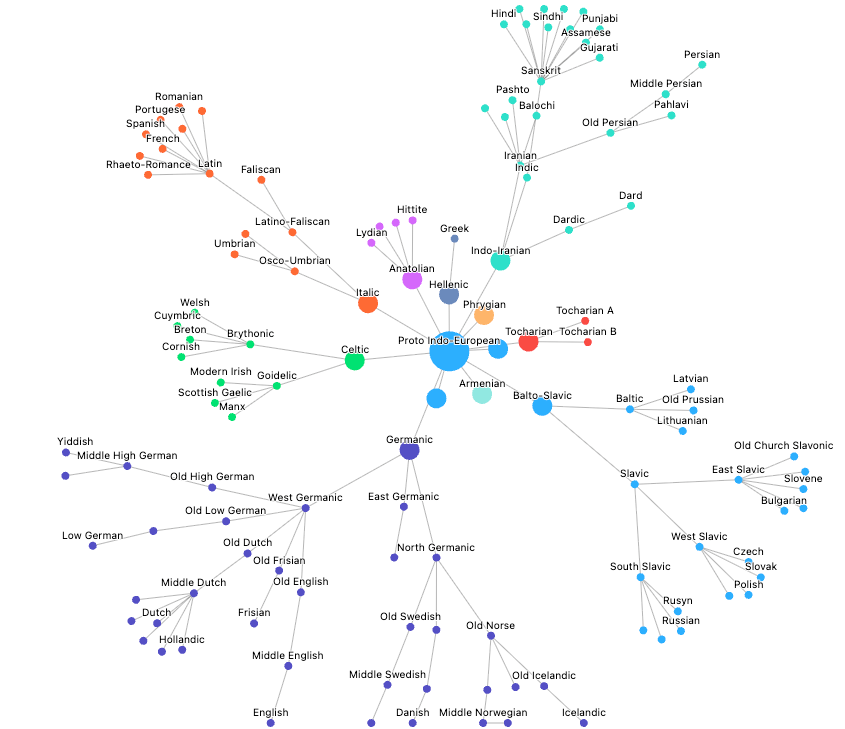
Modernized dashboards and in-context controls
Keep stakeholders engaged with a boardroom-ready design and faster, more focused interactivity:
-
A modernized dashboard: More modern typography, refined spacing, cleaner table padding, and upgraded palettes give every dashboard a contemporary, polished look right out of the box.
-
Filters on visualizations (Preview): Apply and adjust filters directly on individual dashboard tiles, so viewers can isolate specific cuts of data without reloading the entire page.
Applying and adjusting chart-level filters directly on a modernized Looker dashboard tile.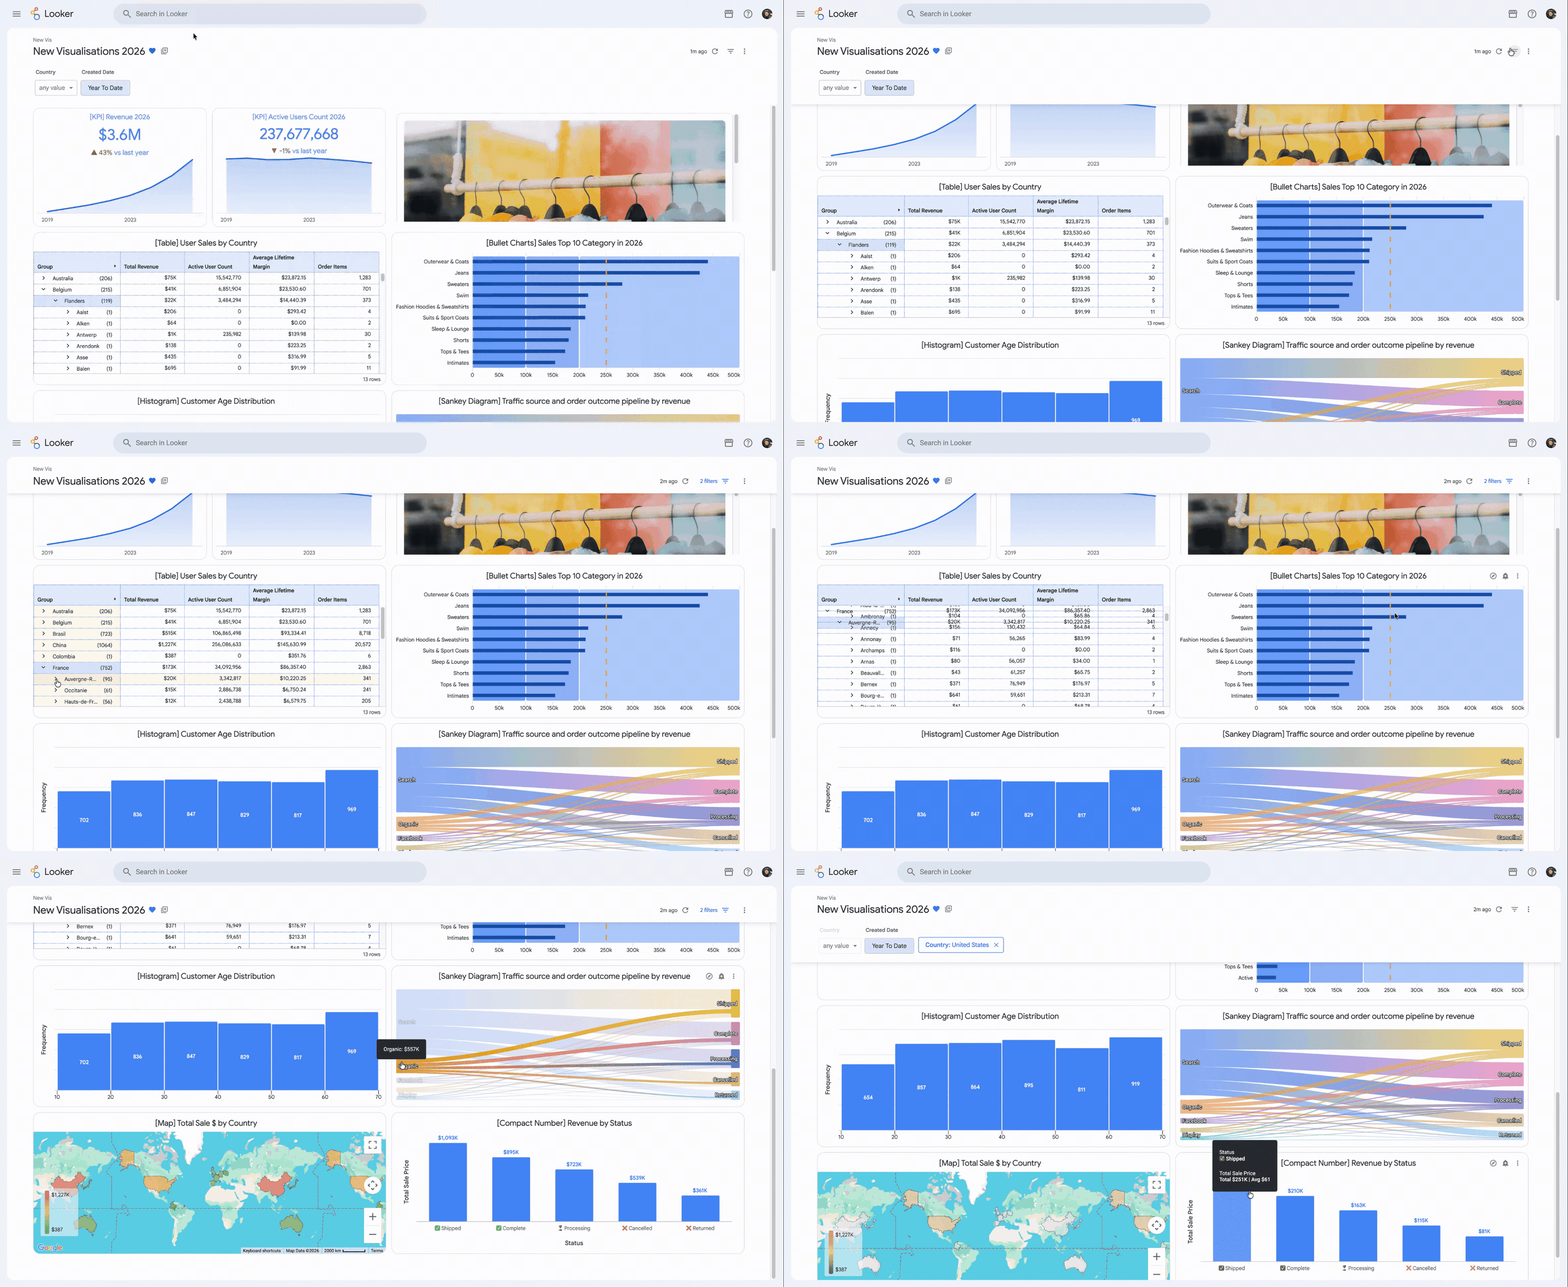
Agent-assisted custom visualizations
Several of the new charts in this release started as custom visualization plugins in the Looker Marketplace. Because they are now supported natively in Looker, we are retiring the associated plugins from the Marketplace. Existing dashboards that use those Marketplace plugins will continue to work.
While Looker’s large native library covers most everyday analytics, every industry has specialized visualization requirements. A chipmaker may need to plot defect density across a silicon wafer map, a logistics team may want to overlay warehouse floor plans onto live shipping metrics, and a finance team might ask for a multi-step variance bridge that follows internal accounting rules. These cases come up often. Previously, building one of these custom charts against Looker’s Visualization API meant either writing JavaScript yourself or waiting for a front-end developer to help. Looker’s agentic BI changes that.
To support these domain-specific builds, we are launching a new custom visualization skill in the open-source looker-skills repository. This skill lets you use your AI coding agent of choice, such as Antigravity, Claude or Codex, to develop, test, iterate, and deploy your own custom visualizations. Describe the chart in natural language, and the agent writes the code against Looker’s Visualization API. You can refine the design conversationally until the chart looks right, and then have the agent deploy it for you.
Sunburst, KPI radar, and calendar heatmap charts generated with the Looker custom visualization skill.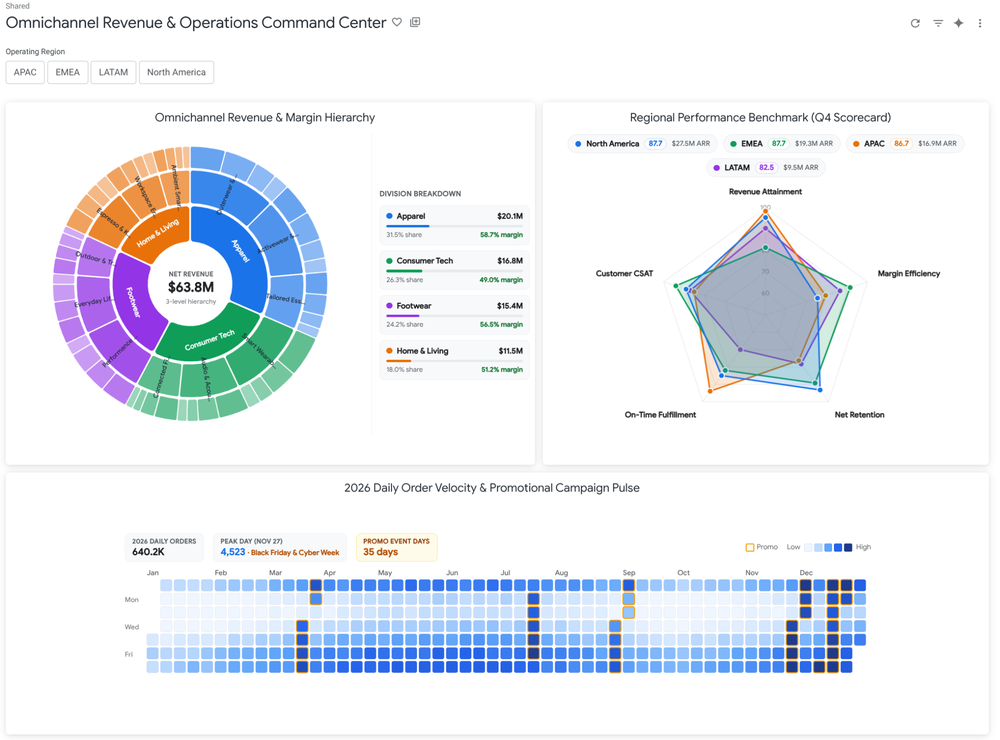
Nobody on your team needs to know JavaScript. Still, if you prefer a specific JavaScript library, you can ask for D3, Vega-Lite, ECharts, Chart.js, or React, or have the agent draw the chart from scratch in SVG. Whatever approach you pick, the chart receives the underlying data from your LookML model and inherits native drill menus, cross-filtering, and dashboard controls alongside your standard tiles.
This same visual system and agent-driven workflow also powers Looker Data Apps ( in preview). When your use case grows beyond a single custom chart tile into a multi-step operational workflow, you can use your AI agent to assemble a full data app that shares Looker’s modernized typography, palettes, and governed LookML metrics. Whether you’re adding a bespoke chart to an existing dashboard or building a standalone application, every view stays consistent and grounded in the same semantic model.
Getting started
-
Explore the new native visualizations and modernized dashboard controls in your Looker environment today, or visit the Looker documentation to learn more.
-
Try the custom visualization skill in your own Looker project by visiting the open-source looker-skills repository on GitHub.