
When enterprises transition from using simple chat assistants to autonomous, agentic workloads, they quickly run into a hard truth: Agents are prone to inaccurate insights when working with directly raw tables.
BigQuery Graph helps organizations move beyond flat, static tables to represent enterprises exactly how they exist in the physical world: as interconnected business entities with real-world dependencies. With the support of measures in BigQuery Graph (preview), we are unifying governed metrics with relationship mapping. This allows your agents to reason across complex dependencies captured in graphs with precision of measures.
Why relationships matter
Traditional data structures are blind to multi-hop business context, causing AI agents to make incorrect operational decisions:
-
The concrete problem: If a retailer has an agent who is asked why winter jacket sales dropped 12% in Seattle, it can query flat tables to report the what (the 12% dip). But it fails at the why because it cannot trace the relational path: Seattle orders ➔ distribution centers ➔ suppliers delayed by regional storms.
-
The risk of disjointed systems: Lacking relationship context, the agent suggests an irrelevant 15% markdown campaign, needlessly eroding margins. Furthermore, maintaining separate systems – where one team maps supplier relationships in a separate graph database while another maintains SQL metrics – forces your agent to stitch these stacks together at runtime. This process is slow, expensive, and leads to inconsistent KPI calculations.
Measures in BigQuery Graph solves this by letting you map existing tables to a property graph in-place with zero ETL. This unified setup enables a logical evolution of inquiry:
-
Metadata grounding establishes what data you have.
-
Business metrics (measures) calculate how your business performed.
-
Relationship mapping (graph) uncovers why it happened.
Under the hood
Historically, standard SQL joins during graph traversals duplicate rows, leading to incorrect aggregation calculations. BigQuery Graph solves this natively.
Data modelers define a MEASURE (like SUM or AVG) directly within the Property Graph DDL. Using standard SQL via the GRAPH_EXPAND function and the AGG aggregator, the engine resolves the structural graph paths before evaluating metrics. This ensures your agent is smart enough to know when it needs a calculator (SQL) and when it needs a map (graph).
Because public projects like bigquery-public-data are strictly read-only, you must map the logical property graph inside your own project using a placeholder variable (YOUR_PROJECT_ID), while directly referencing the read-only public tables as nodes and edges.
- code_block
- <ListValue: [StructValue([('code', '– 1. Map the graph inside YOUR project rnrnrnCREATE OR REPLACE PROPERTY GRAPH `YOUR_PROJECT_ID.YOUR_DATASET.thelook_ecommerce_graph`rnNODE TABLES(rn `bigquery-public-data.thelook_ecommerce.users` AS Userrn KEY(id)rn LABEL User PROPERTIES(id, city, country),rn `bigquery-public-data.thelook_ecommerce.orders` AS Orderrn KEY(order_id)rn LABEL Order PROPERTIES(rn order_id, rn MEASURE(AVG(num_of_item)) AS avg_items_per_order,rn MEASURE(SUM(num_of_item)) AS total_itemsrn )rn)rnEDGE TABLES(rn `bigquery-public-data.thelook_ecommerce.orders` AS OrderedByrn SOURCE KEY(order_id) REFERENCES Order(order_id)rn DESTINATION KEY(user_id) REFERENCES User(id)rn LABEL ORDERED_BYrn);rnrn– 2. Query your new graph with standard SQL—using standard {Label}_{Property} column outputsrnSELECTrn User_city AS city,rn ROUND(AGG(Order_avg_items_per_order), 2) AS agg_avg_items,rn ROUND(AGG(Order_total_items), 2) AS agg_total_itemsrnFROM GRAPH_EXPAND("YOUR_PROJECT_ID.YOUR_DATASET.thelook_ecommerce_graph")rnGROUP BY User_cityrnORDER BY agg_total_items DESCrnLIMIT 10;'), ('language', ''), ('caption', )])]>
Democratizing graph intelligence in BigQuery Studio
To make managing and deploying these relationship networks frictionless for both developers and business users, we have built native, intuitive operational tools directly into BigQuery Studio:
-
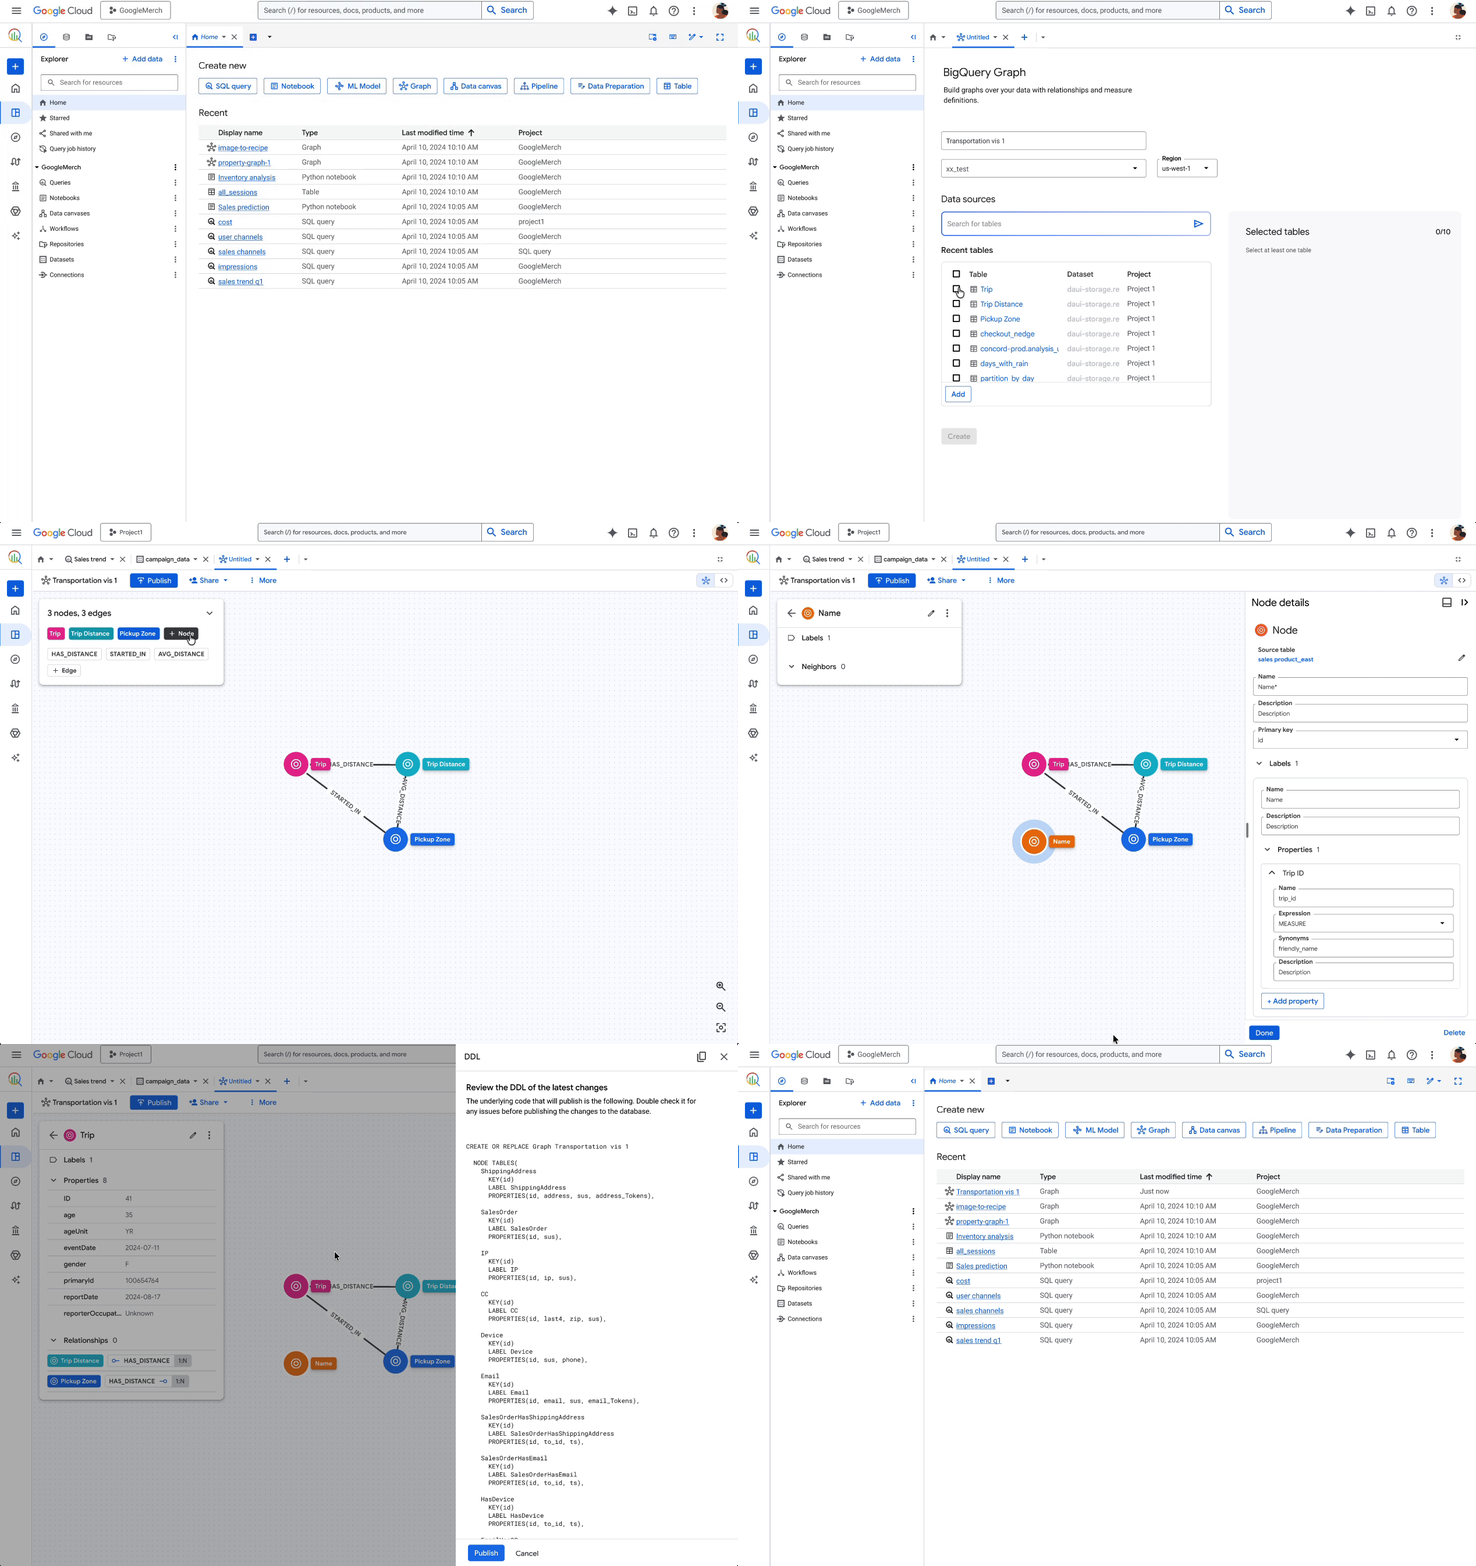
Visual graph modeler: A no-code, drag-and-drop interface inside BigQuery Studio that lets you visually build, edit, and map property graphs, nodes, and edges without writing complex DDL scripts manually.
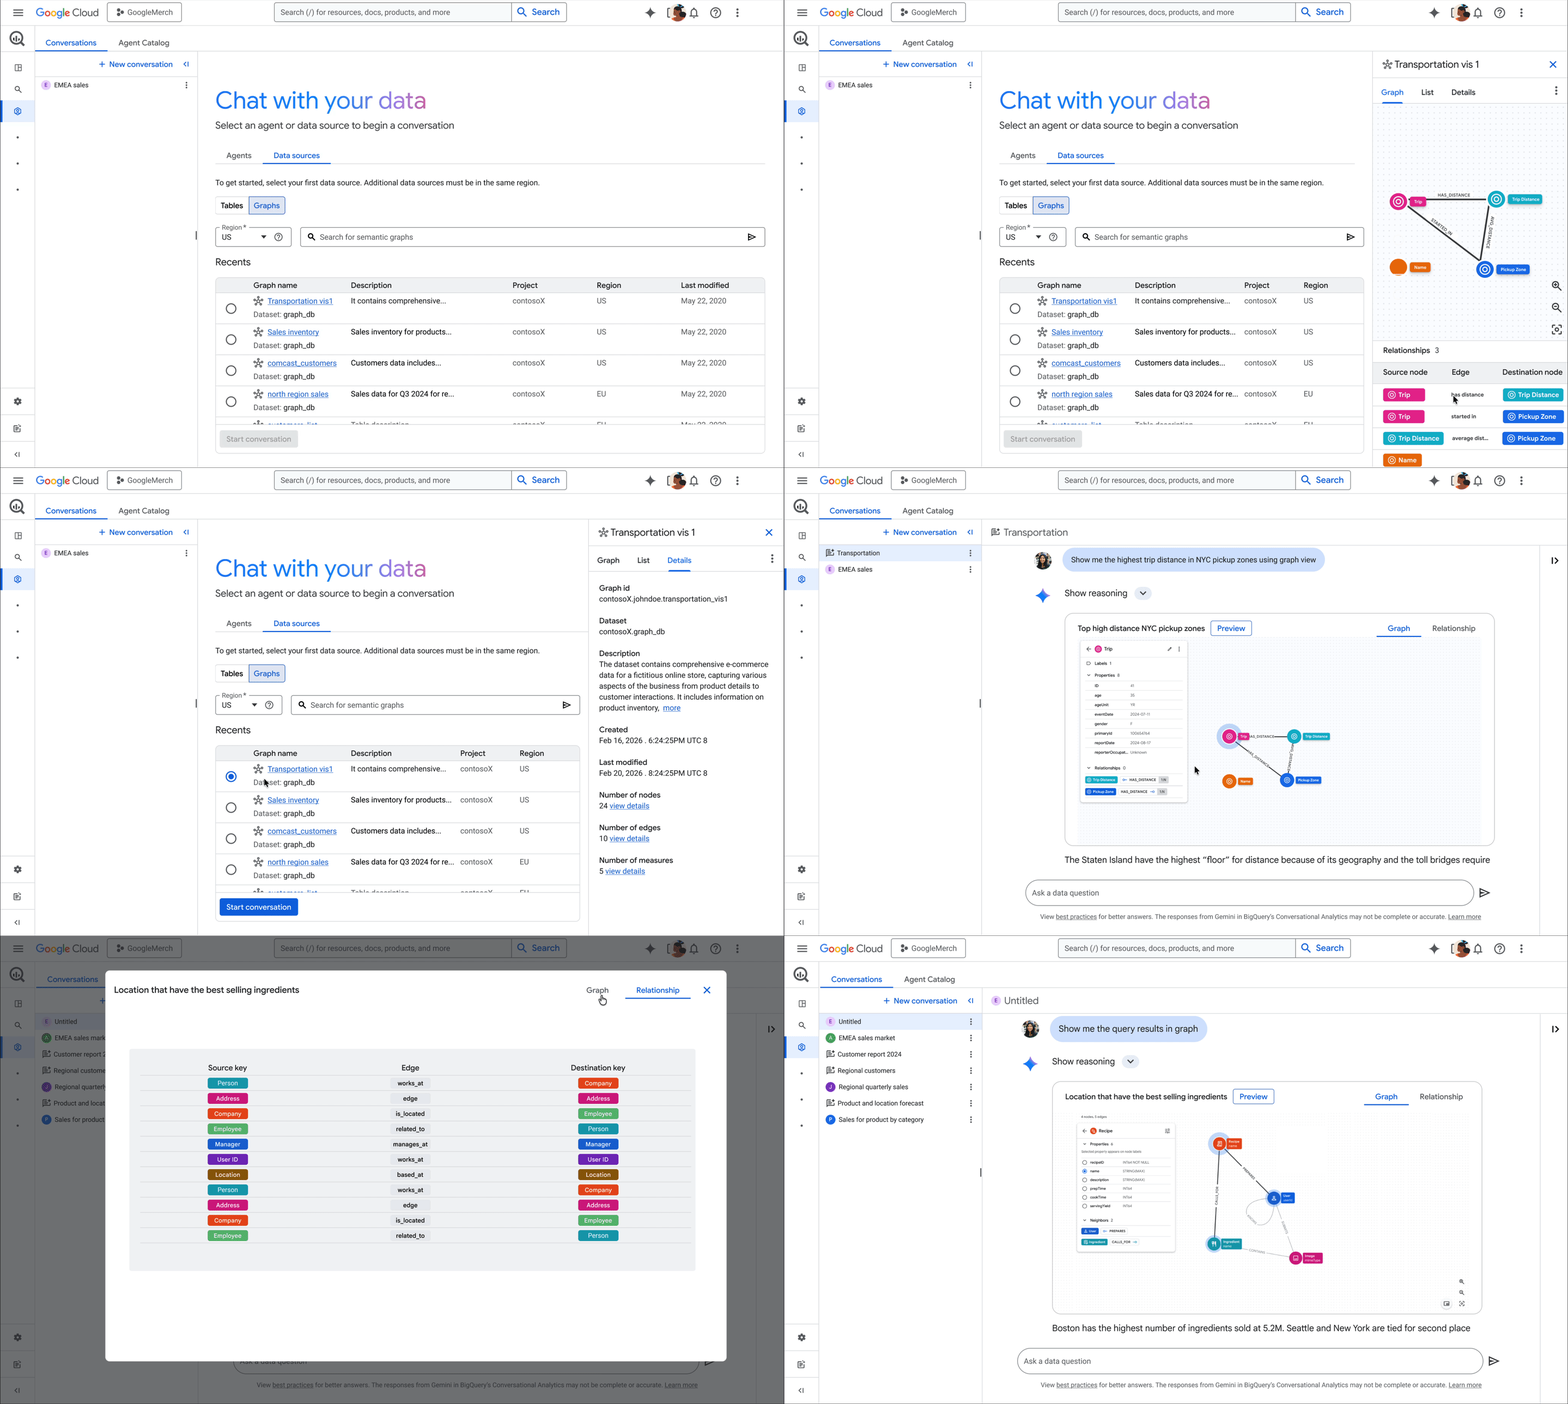
- Conversational Analytics (CA) integration: Users can interact with the graph naturally. Instead of guessing table joins, Conversational Analytics agents navigate the deterministic, relationship-aware map of the graph, converting natural language questions into precise, boundary-constrained GoogleSQL or ISO GQL queries. This prevents model hallucinations and enforces semantic consistency.
Unified semantics: Native Looker integration
To avoid maintaining fragmented logic stacks, business metrics must live at the data layer. By integrating Looker (LookML) natively with BigQuery Graphs as in-database analytic models, you define logic once at the core:
- Database-managed models (sql_analytic_model_name): Point Looker directly to your database-defined BigQuery Graph using
sql_analytic_model_nameto map standard LookML dimensions and measures directly to your graph properties. - Looker-managed models (derived_analytic_model): Define your BigQuery Graph schema directly inside your LookML view using
derived_analytic_model. Looker will dynamically generate and execute the SQL DDL statements to maintain the graph inside BigQuery. - Enterprise DevOps workflows: Manage your graph’s entire lifecycle using the Looker IDE, Git-based version control, and Continuous Integration (CI). Core KPIs (like Churn Rate) remain completely identical, verified, and trusted.